It is important to be mindful as teachers that everything we bring into the classroom serves a direct purpose to improve students’ learning or well-being, and we must remember that everything we do in the classroom has an opportunity cost associated with it. For instance, any decorative posters on display cover wall space that cannot be used for a word wall or some other learning tool. A teacher may determine that such a poster does bring more value to their classroom, and is an example of the type of decisions teachers make all the type, regardless of whether they are conscious of them. This is especially true for any technology we choose to use. We must be clear what the benefits are, and ask what we are giving up if we choose to implement it? And alternatively, what are we giving up if we choose not to?
I found that our class discussions today around different types of information visualization – sketchnoting and infographics – helpful examples in thinking about this. I chose to do my sketchnote digitally as an opportunity to practice drawing on my tablet (it’s new so I’m not familiar with it yet), but it can also be done with pen and paper. Sketchnoting is a note-taking method that involves the learner combining text with drawing meaningful pictures and other visualizations. As was discussed in class, there is compelling research to suggest that a combination like this is beneficial for memory consolidation, making it a potentially useful technique for any classroom, even with only pictures for younger children who can’t write yet. While sketchnoting can be effectively done either digitally or not, creating effective infographics is something that is best achieved digitally, as we did in class using Canva. Unlike sketchnoting – where the purpose is to enhance the leaning of the individual – the aim of infographics is to use well-designed images and text to concisely communicate an idea to someone else in an attractive manner, which is hard to do without computer graphics.

So how does this relate to implementation of technology in the classroom? Both are useful examples to view through the lens of the SAMR theory of technology adoption, which stands for Substitution, Augmentation, Modification, and Redesign. Sketchnoting on a tablet rather than with a pen and paper (as I did) is a great example of Substitution – technology is utilized, but there is no meaningful difference in how the task is actually performed. Doing a sketchnote on a tablet doesn’t really add any function or benefit that is not already provided by using a pen and paper. So knowing this, what would be the opportunity cost of using this in a classroom setting? If I choose to do a sketchnoting activity with a classroom of students using tablets, I first need to invest the time required to teach the students how to use the drawing problem. I also need to assume that there will be issues that I will need to take time to troubleshoot, including dealing with students who feel anxiety with technology. There is also the time required to distribute and collect the tablets, to say nothing of the upfront and maintenance costs of the devices. If I choose to use pen and paper instead, I don’t invite any of these downsides. And since the students are already familiar with the method, there are no downsides to using this method instead.
As the SAMR theory explains, teachers should try to avoid including technology that falls in the Substitution category – in examples like the one above, it often just isn’t worth the opportunity cost because there is no additional value. If the technology a teacher is considering falls into one of the other three categories, however, then it is more likely to be worth implementing. A technology that augments a task by adding functions not otherwise present or modifies it by changing the task in meaningful ways may be worth the additional downsides that come with technology.
I would argue that the infographic activity we did using Canva during class falls into the final SAMR category of Redesign, where the task is something that is not essentially possible without technology. While an argument could be made for modification, creating an infographic digitally is something that I don’t think can be replicated well without technology. Teachers may or may not wish to use Canva or infographics, but it is these types of activities where the value of technology in the classroom is best able to shine. If including technology provides a means to include activities that would not otherwise be possible, then the benefits of including it are likely to far outweigh the drawbacks. The primary drawback: not being able to an engaging activity with the potential to enhance learning.

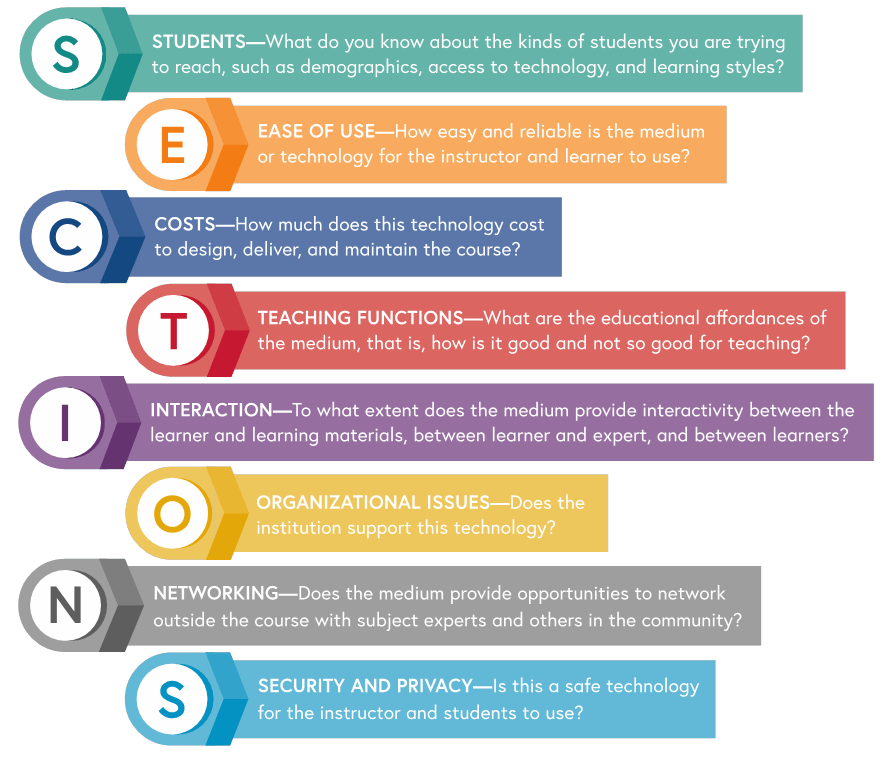
I have mentioned a few times the potential drawbacks of using technology, which should not be overlooked, and the SECTIONS model is a helpful tool to evaluate these. For example, a teacher may feel that having students create an infographic with Canva would be a great class project. However, what should the teacher do if there are administrative or privacy concerns? Or if students lack access to Canva because they don’t have the technology, or they don’t have a Google account? Can the teacher predict how easily the students will be able to use Canva? These are the types of questions that the Sections model prompts us as educators to ask, and are questions we must ask if we want to implement technology in the way that best supports our students.
Though not discussed in this post, what about how technology can be used to increase accessibility for diverse learners? Kevin in his post Week 5: EdTech Theories in Practice! suggested using a Nintendo Switch to play Wii sports for Physical & Health Education – maybe this is could be valuable for students with diverse needs?
Leave a Reply
You must be logged in to post a comment.